Indexes can play a big part in the performance in AX and not always in a positive way. This post will take us through finding out what missing indexes SQL has noticed, formatting the data so that we can better understand which would have the biggest impact on AX based on how often they were used and the cost of the query.
*Update, the attached SQL query gives you the same output but without the manual creation of file.
“USE YourDatabase
GO
SELECT db.[name] AS [DatabaseName]
,id.[object_id] AS [ObjectID]
,OBJECT_NAME(id.[object_id], db.[database_id]) AS [ObjectName]
,id.[statement] AS [FullyQualifiedObjectName]
,id.[equality_columns] AS [EqualityColumns]
,id.[inequality_columns] AS [InEqualityColumns]
,id.[included_columns] AS [IncludedColumns]
,gs.[unique_compiles] AS [UniqueCompiles]
,gs.[user_seeks] AS [UserSeeks]
,gs.[user_scans] AS [UserScans]
,gs.[last_user_seek] AS [LastUserSeekTime]
,gs.[last_user_scan] AS [LastUserScanTime]
,gs.[avg_total_user_cost] AS [AvgTotalUserCost] — Average cost of the user queries that could be reduced by the index in the group.
,gs.[avg_user_impact] AS [AvgUserImpact] — The value means that the query cost would on average drop by this percentage if this missing index group was implemented.
,gs.[system_seeks] AS [SystemSeeks]
,gs.[system_scans] AS [SystemScans]
,gs.[last_system_seek] AS [LastSystemSeekTime]
,gs.[last_system_scan] AS [LastSystemScanTime]
,gs.[avg_total_system_cost] AS [AvgTotalSystemCost]
,gs.[avg_system_impact] AS [AvgSystemImpact] — Average percentage benefit that system queries could experience if this missing index group was implemented.
,gs.[user_seeks] * gs.[avg_total_user_cost] * (gs.[avg_user_impact] * 0.01) AS [IndexAdvantage]
,’CREATE INDEX [IX_’ + OBJECT_NAME(id.[object_id], db.[database_id]) + ‘_’ + REPLACE(REPLACE(REPLACE(ISNULL(id.[equality_columns], ”), ‘, ‘, ‘_’), ‘[‘, ”), ‘]’, ”) + CASE
WHEN id.[equality_columns] IS NOT NULL
AND id.[inequality_columns] IS NOT NULL
THEN ‘_’
ELSE ”
END + REPLACE(REPLACE(REPLACE(ISNULL(id.[inequality_columns], ”), ‘, ‘, ‘_’), ‘[‘, ”), ‘]’, ”) + ‘_’ + LEFT(CAST(NEWID() AS [nvarchar](64)), 5) + ‘]’ + ‘ ON ‘ + id.[statement] + ‘ (‘ + ISNULL(id.[equality_columns], ”) + CASE
WHEN id.[equality_columns] IS NOT NULL
AND id.[inequality_columns] IS NOT NULL
THEN ‘,’
ELSE ”
END + ISNULL(id.[inequality_columns], ”) + ‘)’ + ISNULL(‘ INCLUDE (‘ + id.[included_columns] + ‘)’, ”) AS [ProposedIndex]
,CAST(CURRENT_TIMESTAMP AS [smalldatetime]) AS [CollectionDate]
FROM [sys].[dm_db_missing_index_group_stats] gs WITH (NOLOCK)
INNER JOIN [sys].[dm_db_missing_index_groups] ig WITH (NOLOCK) ON gs.[group_handle] = ig.[index_group_handle]
INNER JOIN [sys].[dm_db_missing_index_details] id WITH (NOLOCK) ON ig.[index_handle] = id.[index_handle]
INNER JOIN [sys].[databases] db WITH (NOLOCK) ON db.[database_id] = id.[database_id]
WHERE db.[database_id] = DB_ID()
–AND OBJECT_NAME(id.[object_id], db.[database_id]) = ‘YourTableName’
ORDER BY ObjectName, [IndexAdvantage] DESC
OPTION (RECOMPILE);
”
Manual Way:
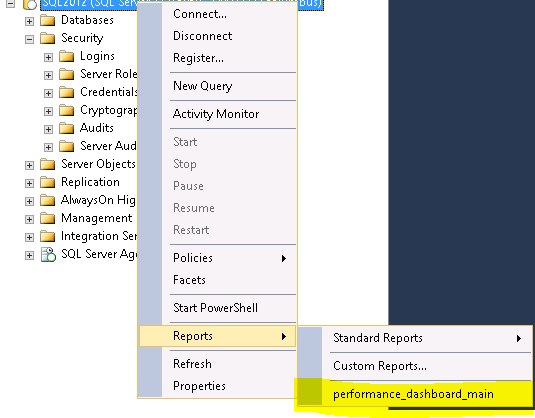
First we check the missing index report from the performance dashboard in SQL.
Load up SQL, right click and open up the dashboard as shown below.
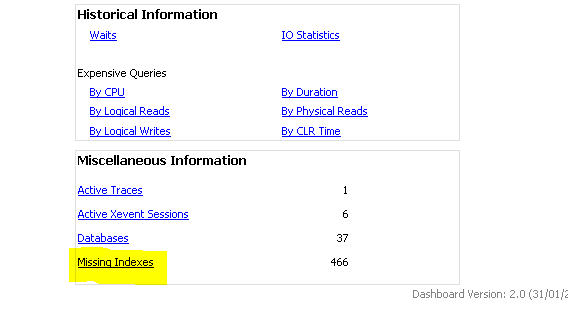
Once the dashboard is loaded you at the bottom right you will see a hyper link for “Missing indexes” as show below
Once you have the report generated right click and export to excel and save the file, upon opening the file you will see something similar to the below.
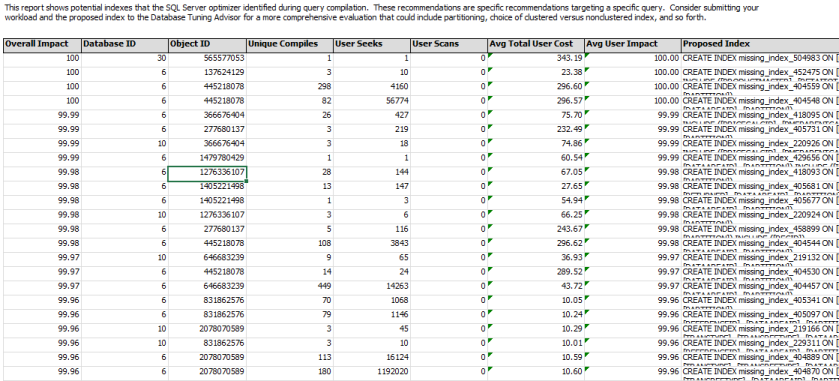
We don’t want to go adding all the mixing indexes in, just the ones we deem fit from an AX perspective and also performance increase. The issue with the data is that it might well show a very high Avg Total User Cost but then a very low Overall impact and User seeks. This would not always be the top of our list to add as with a low impact it may not improve the user experience, however on the flip side if we have an impact of 99% but a low Avg Total User Cost then it would be saving high amounts of nothing.
The best way to get an accurate understanding of the data we have is to create a new column (weighted) and do “Avg Total User Cost * Overall Impact” this will give us a figure that we can filter on then cross reference with user seeks to get our shortlist for testing.
The current Excel sheet has merged columns so we need to create the new “Avg Total User Cost * Overall Impact” column (weighted) then copy all the data into a new sheet without the merges and you will hopefully see something like the following.
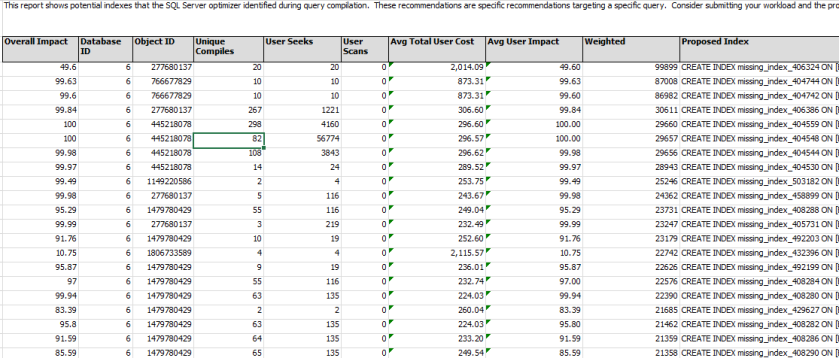
I have sorted the data by the “Weighted” column, which cross referencing it with the “User Seeks” column we can make an educated call with which indexes we should be applying.
Testing: Personally before we add these to the code to be applied during the next code release I would create them in SQL against a non-production database and have users running testing on processes that will hit it. Once it is approved they would then be converted to AX code and applied that way.